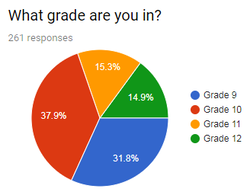
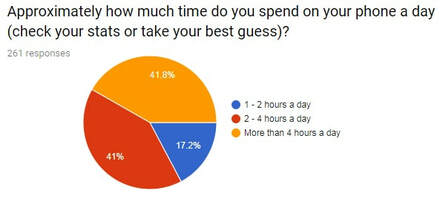
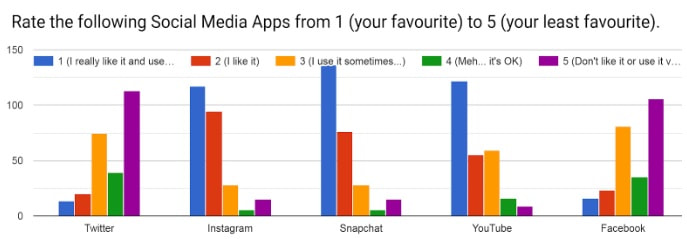
 Question 1 Question 1 As part of my Major Project on presenting to students about smartphone use I thought it would be engaging to have some relevant data gathered from the students being presented to. As I discussed in a previous blog, I was going to gather real-time data during the presentation but decided against this, as I was worried it would take too much time and overload the wifi. So I chose to gather the data earlier using Google Forms at a school wide assembly that our Principal and Vice-Principal were hosting while we were in a teacher area meeting (thank you to them for the help and support). Of about 550 students present for the assembly, I received 261 responses, which although far from perfect, I am happy with as it is a statistically significant portion of the student body (we have about 720 students at our school so this represents about 36% of the student population).  Question 2 Question 2 On a side note, I would like to highly recommend Google forms to anyone who is thinking of organizing a survey as it is easy to use, has many great options and relays the data in very visually pleasing and meaningful graphics. If you wanted verbal feedback or just a survey with a class, grade or whole school it is a wonderful tool that I will use in the future. In looking at the data there were three pieces of information I asked for. Which grade a student responding was in (Question 1). How much they used their phone a day (Question 2). And lastly, which apps / social media they preferred on a scale of 1 to 5 (each number could only be chosen once, so it was a fixed rating scale - Question 3). I had 83 grade 9’s, 99 grade 10’s, 40 grade 11’s and 39 grade 12’s respond to the survey which is displayed by the pie chart in Question 1. I think this speaks closely to who was in attendance at the 8:30 am school wide assembly, as more senior students have learned that it is impossible to do attendance at these events, and so many choose to wait on modified schedule days until period 1 starts at 8:50 am. Also, younger students seem to engage more with what is being asked of them by the school and school personnel. In terms of time spent on the phone, I broke the second question on the survey into three choices: 1 to 2 hours a day, 2 to 4 hours and more than 4 hours a day. I had 17.2% choose 1 to hours a day, 41% choose 2 to 4 hours and 41.8% choose more than 4 hours a day on their phones. If I were to do it again I think I would have four choices with 3-4 hours a day and more than 5 hours being the last two choices, as I was surprised at the number that spend over 4 hours a day and would like more specific information based on this higher number. I will use this data during the presentation to talk about how much time this relates to in a month, year and even a lifetime of phone use, which hopefully shocks some students into reflecting at the significance of these numbers over longer periods of time. For example, the last calculation I show in my presentation, is that if you spent 5 hours a day on your phone (of the 16 hours you are awake) and you lived to be 75 years old then this would be about 23 ½ years of your awake time staring at that screen! I think this will hopefully cause students to pause and think about how they spend their time and how much time adds up over the years. The last question on the survey (Question 3 - below) had students rank five social media platforms: Twitter, Instagram, Snapchat, YouTube and Facebook. They could choose between 1 (least preferred) to 5 (most preferred) for each application without repeating rankings (ie. a student could not put a 2 for Instagram and YouTube). This question was directly related to the study by the RSPH (Status of Mind) I blogged about in my first Major Project blog, whereby different social media platforms have different effects on our mental health (Pg 18 - 23). I wanted to see which apps were most popular with our students and then highlight how these platforms might be negatively affect youth personal mindsets as all but YouTube had a net negative effect on mental health based on this study in the United Kingdom. Not surprising to me was the fact the Snapchat and Instagram were rated by students as the most popular (both having 212 combined votes for “I really like it”, 1, or “I like it”, 2, of the 1305 ratings given, 261 students multiplied by 5 ratings) and these two apps are rated as having the most negative impact on youth mental health. This is not good news. Snapchat, “according to reports in May 2016, ... estimated worth was ... approaching $22 billion [60]”(Wikipedia - Snapchat - Funding and Shares) and Instagram had a “market capitalization ...valued at over US$25.6 billion in October 2018.” (Wikipedia - Twitter - Finances) So the popularity of these platforms are not surprising based on their values. Everyone loves them, but they are not having positive effects on our mental health! Without sounding like a statistician, it seems the data I gathered supports my hypothesis that youth in our school are spending too much time on phones and especially with apps that are having negative impacts on their mental well-being. I will now work to finish up my presentation to make students aware of this data, how much time they are spending / wasting, the potential negative effects of various apps, how addictive these social platforms can be and the impact on sleep, driving safety and even school success. I hope it plants a seed of awareness in the students I present to, to reflect on their screen time, life goals and mental well-being creating better digital citizens who grow up to be high functioning, successful adults who use their phones as tools and not addicts fundamentally attached to their devices. 4/11/2019 07:29:29 am
These smart phone stats were really eye opening! Great data collection! It's going to be a tricky balance that educators need to be aware of, with programs like Google Classroom and Docs we are cutting down on the amount of paper being used BUT at the expense of increasing screen time. It is a tricky balance that needs to be maintained. Again great job! 3/3/2022 06:59:04 am
This is a very informative—edifying article to all. Thanks a lot! Continue to post! 3/23/2022 11:02:13 pm
I very much appreciate it. Thank you for this excellent article. Keep posting! Comments are closed.
|
AuthorDylan Johns Categories
All
Archives
April 2022
|


 RSS Feed
